
For the latest data, please visit the RHESSI Data Archive.
Imaging Algorithm Test
The philosophy at the basis of this investigation is to evaluate the relative suitability of the various RHESSI imaging algorithms to address user-relevant criteria.
We do not want to give credence to algorithms in mutual agreement in the analysis of real flares but just to algorithms in agreement with some realistic but synthetic ground truth. In our intention, there are two goals here: to provide a kind of practical guide about the different reliability of the different methods for reconstructing the different flaring morphologies; to establish the reliability degree of previously published results which utilized images reconstructed from rhessi data.
HESPE imaging test implemented the following 4 steps
Step 1. Invention of source configuration (team involving UNIGE, UCB, NASA GSFC)
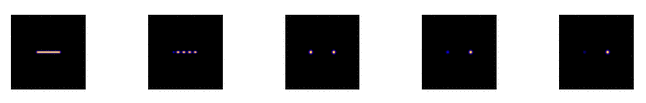
The following five configurations of the flaring region have been invented, characterized by very different topographical and physical properties (size, position, number and distance of disconnected components, relative intensity of the components). The characteristics of these configurations are somehow extreme and have been created in order to point out the imaging conditions for which the reconstruction methods may fail to be effective and inaccurate.
Step 2. Generation of calibrated event lists (R. Schwartz at NASA GSFC)
For each flaring configuration three different synthetic calibrated event lists mimicking a RHESSI acquisition have been generated corresponding to three different levels of statistics (an average of 1000 counts per detector for the low level, 10000 for the medium level, 100000 for the high level).
Step 3. Application of the reconstruction methods
The following methods have been applied
- Visibility Forward Fit (run by M. Battaglia at UNIGLA).
- CLEAN (default and enhanced; run by A. Gopie at NASA GSFC).
- Pixon (run by R. Schwartz at NASA GSFC).
- uv_smooth (run by A. M. Massone at UNIGE).
- Maximum Entropy (run by A. M. Massone at UNIGE).
- Expectation Maximization (run by F. Benvenuto at UNIGE).
The reconstructions provided by the five methods for the three different levels of statistics and for three different combinations of RHESSI detectors can be found here.
Step 4. Assessment of results
A set of routines was applied by A. M. Massone at UNIGE for the quantitative assessment of the algorithms’ performances. These routines computed specific and geometrical parameters in the images and compare the reconstructed values with the corresponding ground truth values in the simulated maps.
This kind of imaging test has been applied also to the following second family of source configurations inspired by specific real events observed by RHESSI:
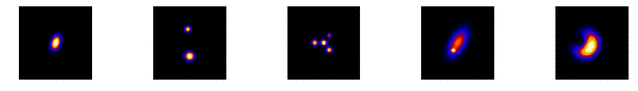
This family includes configurations resembling events occurred on
- May 21 2004 (23:47:00 – 23:50:00 UT; 16 – 18 keV)
- February 20 2002 (11:06:02 – 11:06:34 UT; 22 – 26 keV)
- July 23 2002 (00:29:10 – 00:30:19 UT; 36 – 41 keV)
- December 2 2003 (22:54:00 – 22:58:00 UT; 18 – 20 keV)
- August 23 2005 (14:27:00 – 14:31:00 UT; 14 – 16 keV)
In this case four reconstruction methods have been applied: CLEAN (default), Pixon, Maximum Entropy and uv_smooth. The reconstructed images can be found here.
An analysis of the outcome of the assessment routines for all ten configurations considered in the two tests allowed the realization of the look-up tables that can be found here. In these tables
- The red color means: “bad performance”.
- The yellow color means: “possible weaknesses”.
- The green color means: “reliable performance”.
Synthetic Visibilities
Download the synthetic visibility database.